Business Analyst Courses : Business analysis is a set of methods used to identify business requirements, analyze them, and document the results. BA is a critical activity that supports many other processes throughout an organization. This course provides the foundation needed to understand the concepts, tools, techniques, and terminology associated with BA.
2. Requirements Gathering & Analysis
Requirements gathering and analysis involve identifying and documenting the needs of an organization. These activities can be performed at any stage of a project, but they tend to occur earlier in the lifecycle of a project. This course covers the various types of requirements, including functional, non-functional, quality, performance, and capacity requirements.
3. Project Planning & Management
Project planning and management involves defining, scheduling, executing, monitoring, controlling, and closing projects. This course covers the basic elements of project planning and management, including scope definition, schedule creation, resource allocation, risk mitigation, change control, and closure.
4 Project Management Professional (PMP)
The PMP certification is the industry standard for project management professionals. This course provides students with the knowledge they need to pass the exam and become certified.
5. Six Sigma Green Belt
Six Sigma is a quality improvement methodology that helps companies reduce defects and improve customer service. This course teaches students how to implement this method into their business operations.
6. Certified Associate in Project Management (CAPM)
This CAPM course prepares students for the Project Management Institute’s (PMI) Project Management Professional (PMI-PgMP) examination. Students learn about the fundamentals of project management and gain experience through hands-on projects.
7. Certified Associate (CA) –
This course covers the basics of business analysis including project management, requirements gathering, stakeholder identification, risk assessment, communication planning, and documentation.
8. Certified Practitioner (CP) –
This course focuses on advanced topics like data modeling, software testing, information architecture, and enterprise architecture.
9. Certified Scrum Master (CSM) –
This course teaches agile methodologies and practices that help businesses improve their product delivery processes.
10. Certified Six Sigma Green Belt (C6SGB) –
This course helps students understand how to use statistical tools to analyze quality issues.
11. Certified Software Quality Assurance Professional (CSQAP) –
This course provides knowledge about quality assurance methods and techniques used to ensure that products meet customer expectations.
12. Certified Technical Project Manager (CTPM) –
This course teaches students how to manage projects from start to finish.
13. Business Analysis Professional (BAP)
The BAP certification is designed to help business analysts develop their skills and knowledge in order to perform their job effectively. This course covers the following topics:
Business analysis methodology
Business analysis tools
Business analysis techniques
Business analysis project management
Benefits are advantages by doing the Business Analyst certification courses.
The benefits of getting certified are many. First off, if you have been working in your field for some time now, chances are that you already know what you need to know about the industry. However, it’s always good to get a refresher course and learn something new. You can use this knowledge to help you do better work. Also, if you want to advance your career, having a degree from a reputable institution will give you a leg-up over others who don’t have any formal training.
Another benefit is that you can show employers that you are serious about your job. If you are looking for a promotion or a raise, then you should consider taking additional classes to improve yourself. Employers like to hire people who are willing to invest their time and money into themselves. They also appreciate those who are self-motivated.
Certification programs are designed to teach you how to perform certain tasks in a specific area. This way, you will be able to demonstrate your skills and expertise to potential employers. In addition, these programs provide you with a portfolio of accomplishments that you can share with future employers.
Finally, certification programs are beneficial because they allow you to network with other professionals in your field. When you attend conferences and seminars, you meet people who may become valuable contacts later on. These connections could lead to jobs, promotions, and even opportunities outside of your current company.
Here we mentioned few important Business Analyst courses, hope this article will help you to understand the Business Analyst Courses.
Despite all the benefits data mapping brings to businesses, it’s not without its own set of challenges. Mapping data fields Mapping data fields directly is essential for getting the asked results from your data migration design.
Still, this can be delicate if the source and destination fields have different names or different formats (e.g., textbook, figures, dates). Either, in the case of homemade data mapping, it can be exhausting to collude hundreds of different data fields. Over time, workers may come prone to miscalculations which will ultimately lead to data disagreement and confusing data.
Automated data mapping tools address this issue by introducing automated workflow to this process. Technical expertise Another handicap is that data mapping requires the knowledge of SQL, Python, R, or any other programming language. Sales or marketing specialists use dozens of different data sources which should be counterplotted to uncover useful perceptivity.
Unfortunately, just a small part of these workers knows how to use programming languages. In utmost cases, they’ve to involve the tech platoon in the process. Still, the tech platoon has its own tasks and may not respond to the request this moment. Ultimately, a simple connection between two data sources might take a long time or indeed turn into an everlasting chain of tasks in developers â backlog.
A hardly- concentrated data mapping result could help non-technical brigades with their data integration needs. A drag and drop functionality make it easy to match data fields indeed without knowledge of any programming language. Automated tools make the task indeed easier by shouldering all data mapping tasks. With law-free data mapping, judges can get practicable perceptivity in no time. Data sanctification and harmonization Raw data is by no means useful for a data integration process.
First of all, data professionals have to cleanse the original dataset from duplicates, empty fields, and other types of inapplicable data. That’s a lengthy and quite a routine process if done manually. According to the Forbes check, data scientists spend 80 of their time on data collection, sanctification, and organization.
How data scientists spend their working hours
There’s no escape from this task. Data integration and data migration processes that revolve around unnormalized data will take you nowhere.
More interestingly, five questions always emerge
What do you do with the data that doesn’t chart anywhere (ignore?)?
How do you get data that doesn’t live that’s needed for the mapping (gaps)?
How do you insure the delicacy of the semantic mapping between data fields?
What do you do with nulls?
What do you do with empty fields?
The single topmost assignment in all this?
Make sure data is clean before you resettle, and make sure processes are harmonized! He couldn’t be more right! There’s only one gemstone-solid way to automate data sanctification and normalization. ETL systems can prize data from distant sources, homogenize it, and store it in a centralized data storehouse. Automated data channels take the workload off judges and data specialists, allowing them to concentrate on their primary tasks.
Essential Data Analyst Tools Discover a List of The 14 Best Data Analysis Software & Tools On The Market for Data Analysts
The reason is simple as utmost of the data is stored in relational databases and you need to pierce and unleash its value, SQL is a largely critical element of succeeding in business, and by learning it, judges can offer a competitive advantage to their skillset. Frequently used by people that do n’t have high specialized capacities to law themselves, spreadsheets can be used for fairly easy analysis that does n’t bear considerable training, complex and large volumes of data and databases to manage. Their data disquisition features similar as visualizations and descriptive statistics will enable you to get the information you need while prophetic analytics will help you in cases similar as churn forestallment, threat modeling, textbook mining, and client segmentation.
Best Software For Data Analysts
Top 14 Software & Tools for Data Analysts (2022)
Business intelligence tools
BI tools are one of the most represented means of performing data analysis. Specializing in business analytics, these tools will prove to be salutary for every data critic that needs to dissect, cover, and report on important findings. Features similar as tone- service, prophetic analytics, and advanced SQL modes make these results fluently malleable to every position of knowledge, without the need for heavy IT involvement. By furnishing a set of useful features, judges can understand trends and make politic opinions. Our data analytics tools composition would n’t be complete without business intelligence, and data pine is one illustration that covers utmost of the conditions both for freshman and advanced druggies. This each- by-one tool aims to grease the entire analysis process from data integration and discovery to reporting.
datapine KEY FEATURES
Visual drag-and- drop interface to make SQL queries automatically, with the option to switch to, advanced ( homemade) SQL mode Important prophetic analytics features, interactive maps and dashboards, and automated reporting AI-powered admonitions that are started as soon as an anomaly occurs or a thing is met
datapine is a popular business intelligence software, that’s concentrated on delivering simple, yet important analysis features into the hands of newcomers and advanced druggies that need a fast and dependable online data analysis result for all analysis stages.
An intuitive stoner interface will enable you to simply drag-and- drop your asked values into datapine’s Analyzer and produce multitudinous maps and graphs that can be united into an interactivedashboard.However, you might want to consider the SQL mode where you can make your own queries or run being canons or scripts, If you ’re an educated critic.
Another pivotal point is the prophetic analytics read machine that can dissect data from multiple sources which can be preliminarily integrated with their colorful data connectors.
While there are multitudinous prophetic tools out there, datapine provides simplicity and speed at its finest. By simply defining the input and affair of the cast grounded on specified data points and asked model quality, a complete map will unfold together with prognostications.
We should also mention robust artificial intelligence that’s getting an inestimable adjunct in moment’s analysis processes. Neural networks, pattern recognition, and threshold cautions will alarm you as soon as a business anomaly occurs or a preliminarily set thing is met so you do n’t have to manually dissect large volumes of data – the data analytics software does it for you.
Access your data from any device with an internet connection, and partake your findings fluently and securely via dashboards or customized reports for anyone that needs quick answers to any type of business question.
Statistical Analysis
Tools Next in our list of data analytics tools comes a more specialized are related to statistical analysis. Pertaining to calculation ways that frequently contain a variety of statistical ways to manipulate, explore, and induce perceptivity, there live multiple programming languages to make (data) scientists’ work easier and further effective. With the expansion of colorful languages that are moment present on the request, wisdom has its own set of rules and scripts that need special attention when it comes to statistical data analysis and modeling. Then we will present one of the most popular tools for a data critic – R programming. Although there are other languages that concentrate on (scientific) data analysis, R is particularly popular in the community.
R programming/ R-Studio KEY FEATURES
An ecosystem of further than 10 000 packages and extensions for distinct types of data analysis Statistical analysis, modeling, and thesis testing (e.g. analysis of friction, t test,etc.) Active and communicative community of experimenters, statisticians, and scientists
R is one of the top data critic tools that’s generally appertained to as a language designed by statisticians. It’s development dates back to 1995 and it’s one of the most habituated tools for statistical analysis and data wisdom, keeping an open- source policy and running on a variety of platforms, including Windows and macOS.
RStudio is by far the most popular integrated development terrain. R’s capabilities for data cleaning, data reduction, and data analysis report affair with R cheapie, makes this tool an inestimable logical adjunct that covers both general and academic data analysis. It’s collected of an ecosystem of further than 10 000 packages and extensions that you can explore by orders, and perform any kind of statistical analysis similar as retrogression, conjoint, factor cluster analysis, etc.
Easy to understand for those that do n’t have a high- position of programming chops, R can perform complex fine operations by using a single command.
A number of graphical libraries similar as ggplot and plotly make this language different than others in the statistical community since it has effective capabilities to produce quality visualizations.
R was substantially used in the academic area in the history, moment it has operations across diligence and large companies similar as Google, Facebook, Twitter, and Airbnb, among others. Due to an enormous number of experimenters, scientists, and statisticians using it, R has an expansive and active community where innovative technologies and ideas are presented and communicated regularly.
General- purpose programming languages
Programming languages are used to break a variety of data problems. We’ve explained R and statistical programming, now we will concentrate on general bones that use letters, figures, and symbols to produce programs and bear formal syntax used by programmers. Frequently, they ’re also called textbook- grounded programs because you need to write software that will eventually break a problem. Exemplifications include C Java, PHP, Ruby, Julia, and Python, among numerous others on the request. Then we will present Python as one of the stylish tools for data judges that have rendering knowledge as well.
Python KEY FEATURES
An open- source result that has simple coding processes and syntax so it’s fairly easy to learn Integration with other languages similar as C/ C, Java, PHP, Cetc.
Advanced analysis processes through machine literacy and textbook mining Python is extremely accessible to law in comparison to other popular languages similar as Java, and its syntax is fairly easy to learn making this tool popular among druggies that look for an open- source result and simple coding processes. In data analysis, Python is used for data crawling, drawing, modeling, and constructing analysis algorithms grounded on business scripts.
One of the stylish features is actually its stoner- benevolence programmers do n’t need to remember the armature of the system nor handle the memory – Python is considered a high- position language that isn’t subject to the computer’s original processor.
Another conspicuous point of Python is its portability. Druggies can simply run the law on several operating systems without making any changes to it so it’s not necessary to write fully new law. This makes Python a largely movable language since programmers can run it both on Windows and macOS.
An expansive number of modules, packages and libraries make Python a reputed and usable language across diligence with companies similar as Spotify, Netflix, Dropbox and Reddit as the most popular bones that use this language in their operations. With features similar as textbook mining and machine literacy, Python is getting a reputed authority for advanced analysis processes.
SQL consoles
Our data critic tools list would n’t be complete without SQL consoles. Basically, SQL is a programming language that’s used to manage/ query data held in relational databases, particularly effective in handling structured data as a database tool for judges.
It’s largely popular in the data wisdom community and one of the critic tools used in colorful business cases and data scripts. The reason is simple as utmost of the data is stored in relational databases and you need to pierce and unleash its value, SQL is a largely critical element of succeeding in business, and by learning it, judges can offer a competitive advantage to their skillset.
There are different relational (SQL- grounded) database operation systems similar as MySQL, PostgreSQL, MS SQL, and Oracle, for illustration, and by learning these data judges’ tools would prove to be extremely salutary to any serious critic. Then we will concentrate on MySQL Workbench as the most popular bone.
MySQL Workbench KEY FEATURES
A unified visual tool for data modeling, SQL development, administration, backup, etc. Instant access to database schema and objects via the Object Cybersurfer SQL Editor that offers color syntax pressing, exercise of SQL particles, and prosecution history MySQL Workbench is used by judges to visually design, model, and manage databases, optimize SQL queries, administer MySQL surroundings, and use a suite of tools to ameliorate the performance of MySQL operations.
It’ll allow you to perform tasks similar as creating and viewing databases and objects (triggers or stored procedures,e.g.), configuring waiters, and much further.
You can fluently perform backup and recovery as well as check inspection data.
MySQL Workbench will also help in database migration and is a complete result for judges working in relational database operation and companies that need to keep their databases clean and effective.
Standalone prophetic analytics tools
Prophetic analytics is one of the advanced ways, used by judges that combine data mining, machine literacy, prophetic modeling, and artificial intelligence to prognosticate unborn events, and it deserves a special place in our list of data analysis tools as its fashionability increases in recent times with the preface of smart results that enabled judges to simplify their prophetic analytics processes. You should keep in mind that some BI tools we formerly bandied in this list offer easy to use, erected-in prophetic analytics results but, in this section, we concentrate on standalone, advanced prophetic analytics that companies use for colorful reasons, from detecting fraud with the help of pattern discovery to optimizing marketing juggernauts by assaying consumers’ geste and purchases. Then we will list a data analysis software that’s helpful for prophetic analytics processes and helps judges to prognosticate unborn scripts.
SAS Soothsaying KEY FEATURES
Automatic soothsaying for a large number of realities or products, including hierarchical soothsaying Scalability and modeling by combining 2 or further models and creating an ensemble.
An unlimited model depository that includes time series and casual styles similar as ARIMA and ARIMAX SAS Vaticinating for Desktop has established itself as one of the most prominent advanced data analysis software that offers a wide range of soothsaying styles, including hierarchical conciliation, event modeling, what-if analysis, and script planning.
Their features comprise 7 core areas of soothsaying processes, some of them we formerly mentioned automatic soothsaying, scalability and modeling, unlimited model depository, easy-to- use GUI, event-modeling press, what-if analysis, and data medication. Grounded on the variables that you enter in the modeling process, SAS will automatically elect variables to induce vaticinations to unravel what happens in your business. Also, with a pack of the SAS Forecast Garçon, and Visual Soothsaying results, this data software enables druggies to produce a large number of vaticinations, and automate their processes. Since the company is on the request for decades, they’ve established themselves as an authority figure in prophetic analytics, and it clearly makes sense to give them a pass.
Data modeling tools
Our list of data analysis tools for judges would n’t be complete without data modeling. Creating models to structure the database and design business systems by exercising plates, symbols, and textbook, eventually represent how the data flows and is connected in between. Businesses use data modeling tools to determine the exact nature of the information they control and the relationship between datasets, and judges are critical in this process. However, dissect, and specify changes on information that’s stored in a software system, If you need to discover. Then we will show one of the most popular data critic software used to produce models and design your data means.
erwin data modeler (DM) KEY FEATURES
Automated data model generation to increase productivity in logical processes Single affiliate no matter the position or the type of the data 7 different performances of the result you can choose from and acclimate grounded on your business needs erwin DM works both with structured and unshaped data in a data storehouse and in the pall.
It’s used to “ find, fantasize, design, emplace and regularize high- quality enterprise data means,” as stated on their sanctioned website. erwin can help you reduce complications and understand data sources to meet your business pretensions and requirements.
They also offer automated processes where you can automatically induce models and designs to reduce crimes and increase productivity.
This is one of the tools for judges that concentrate on the armature of the data and enable you to produce logical, abstract, and physical data models.
Fresh features similar as a single interface for any data you might retain, no matter if it’s structured or unshaped, in a data storehouse or the pall makes this result largely malleable for your logical requirements. With 7 performances of the erwin data modeler, their result is largely malleable for companies and judges that need colorful data modeling features.
ETL tools
ETL is a process used by companies, no matter the size, across the world, and if a business grows, chances are you’ll need to prize, load and transfigure data into another database to be suitable to dissect it and make queries. There are some core types of ETL tools similar as batch ETL, real- time ETL, and pall grounded ETL, each with its own specifications and features that acclimate to different business requirements. These are the tools used by judges that take part in further specialized processes of data operation within a company, and one of the stylish exemplifications is Talend.
Talend KEY FEATURES
Collecting and transubstantiating data through data medication, integration, pall channel developer Data governance point to make a data mecca and resolve any issues in data quality Participating data through comprehensive deliveries via APIs
Talend is a data integration platform used by experts across the globe for data operation processes, pall storehouse, enterprise operation integration, and data quality.
It’s a Java- grounded ETL tool that’s used by judges in order to fluently reuse millions of data records, and offers comprehensive results for any data project you might have. Talend’s features include ( big) data integration, data medication, pall channel developer, and sew data haul to cover multiple data operation conditions of an association.
This is an critic software extremely important if you need to work on ETL processes in your logical department. Piecemeal from collecting and transubstantiating data, Talend also offers a data governance result to make a data mecca and deliver it through tone- service access through a unified pall platform.
You can use their data roster, force and produce clean data through their data quality point. Participating is also part of their data portfolio;
Talend’s data fabric result will enable you to deliver your information to every stakeholder through a comprehensive API deliveryplatform.However, Talend might be worth considering, If you need a data critic tool to cover ETL processes.
Robotization Tools
As mentioned, the thing of all the results present on this list is to make data judges life’s easier and more effective. Taking that into account, robotization tools couldn’t be left out of this list. In simple words, data analytics robotization is the practice of using systems and processes to perform logical tasks with nearly no mortal commerce. In the once times, robotization results have impacted the way judges perform their jobs as these tools help them in a variety of tasks similar as data discovery, medication, data replication, and more simple bones like report robotization or writing scripts. That said, automating logical processes significantly increases productivity, leaving further time to perform more important tasks. We’ll see this further in detail through Jenkins one of the leaders in open- source robotization tools.
JENKINS KEY FEATURES
popular Nonstop integration (CI) result with advanced robotization features similar as running law in multiple platforms Job robotizations to set up customized tasks can be listed or grounded on a specific event Several job robotization plugins for different purposes similar as Jenkins Job Builder, Jenkins Job DLS or Jenkins Pipeline DLS Developed in 2004 under the name Hudson, Jenkins is an open- source CI robotization garçon that can be integrated with several DevOps tools via plugins. By dereliction, Jenkins assists inventors to automate corridor of their software development process like structure, testing, and planting. Still, it’s also largely used by data judges as a result to automate jobs similar as running canons and scripts daily or when a specific event happed. For illustration, run a specific command when new data is available. There are several Jenkins’s plugins to induce jobs automatically. For illustration, the Jenkins Job Builder plugin takes simple descriptions of jobs in YAML or JSON format and turns them into runnable jobs in Jenkins’s format.
On the other side, the Jenkins Job DLS plugin provides druggies with the capabilities to fluently induce jobs from other jobs and edit the XML configuration to condense or fix any living rudiments in the DLS. Incipiently, the Pipeline plugin is substantially used to induce complex automated processes. For Jenkins, robotization isn’t useful if it’s not tight to integration. For this reason, they give hundreds of plugins and extensions to integrate Jenkins with your being tools. This way, the entire process of law generation and prosecution can be automated at every stage and in different platforms- leaving judges enough time to perform other applicable tasks. All the plugins and extensions from Jenkins are developed in Java meaning the tool can also be installed in any other driver that runs on Java.
Unified data analytics machines
Still, also unified data analytics machines might be the stylish resolution for your logical processes, If you work for a company that produces massive datasets and needs a big data operation result. To be suitable to make quality opinions in a big data terrain, judges need tools that will enable them to take full control of their company’s robust data terrain. That’s where machine literacy and AI play a significant part. That said, Apache Spark is one of the data analysis tools on our list that supports big-scale data processing with the help of an expansive ecosystem.
Apache Spark KEY FEATURES
High performance Spark owns the record in the large-scale data processing A large ecosystem of data frames, streaming, machine literacy, and graph calculation A collection of over 100 drivers for transubstantiating and operating on large scale data Apache Spark is firstly developed by UC Berkeley in 2009 and since also, it has expanded across diligence and companies similar as Netflix, Yahoo, and eBay that have stationed Spark, reused petabytes of data and proved that Apache is the go-to result for big data operation. Their ecosystem consists of Spark SQL, streaming, machine literacy, graph calculation, and core Java, Scala, and Python APIs to ease the development. Formerly in 2014, Spark has officially set a record in large-scale sorting. Actually, the machine can be 100x faster than Hadoop and this is one of the features that’s extremely pivotal for massive volumes of data processing. You can fluently run operations in Java, Python, Scala, R, and SQL while further than 80 high- position drivers that Spark offers will make your data metamorphosis easy and effective.
As a unified machine, Spark comes with support for SQL queries, MLlib for machine literacy and GraphX for streaming data that can be combined to produce fresh, complex logical workflows.
Also, it runs on Hadoop, Kubernetes, Apache Mesos, standalone or in the pall and can pierce different data sources. Spark is truly a important machine for judges that need support in their big data terrain.
Spreadsheet operations
Spreadsheets are one of the most traditional forms of data analysis. Relatively popular in any assiduity, business or association, there’s a slim chance that you have n’t created at least one spreadsheet to dissect your data. Frequently used by people that do n’t have high specialized capacities to law themselves, spreadsheets can be used for fairly easy analysis that does n’t bear considerable training, complex and large volumes of data and databases to manage. To look at spreadsheets in further detail, we’ve chosen Excel as one of the most popular in business.
Excel KEY FEATURES
Part of the Microsoft Office family, hence, it’s compatible with other Microsoft operations Pivot tables and erecting complex equations through designated rows and columns Perfect for lower analysis processes through workbooks and quick sharing Excel needs a order on its own since this important tool has been in the hands of judges for a veritably long time. Frequently considered as a traditional form of analysis, Excel is still extensively used across the globe.
The reasons are fairly simple there are n’t numerous people who have noway used it or came across it at least formerly in their career.
It’s a fairly protean data critic tool where you simply manipulate rows and columns to produce your analysis.
Once this part is finished, you can export your data and shoot it to the asked donors, hence, you can use Excel as a report tool as well. You do need to modernize the data on your own, Excel does n’t have an robotization point analogous to other tools on our list. Creating pivot tables, managing lower quantities of data and tinkering with the irregular form of analysis, Excel has developed as an electronic interpretation of the account worksheet to one of the most spread tools for data judges.
A wide range of functionalities accompany Excel, from arranging to manipulating, calculating and assessing quantitative data to erecting complex equations and using pivot tables, tentative formatting, adding multiple rows and creating maps and graphs – Excel has surely earned its place in traditional data operation.
Assiduity-specific data analytics tools
While there are numerous data analysis tools on this list that are used in colorful diligence and are applied daily in judges’workflow, there are results that are specifically developed to accommodate a single assiduity and can not be used in another. For that reason, we’ve decided to include of one these results on our list, although there are numerous others, assiduity-specific data analysis programs and software. Then we concentrate on Qualtrics as one of the leading exploration software that’s used by over 11000 world’s brands and has over 2M druggies across the globe as well as numerous assiduity-specific features concentrated on request exploration.
QUALTRICS KEY FEATURES
4 main experience features client, brand, hand, and product Fresh exploration services by their in- house experts Advanced statistical analysis with their Stats command analysis tool Qualtrics is a software for data analysis that’s concentrated on experience operation and is used for request exploration by companies across the globe.
They offer 4 product pillars the client experience, brand, hand, and product experience, and fresh exploration services performed by their own experts. Their XM platform consists of a directory, automated conduct, Qualtrics command tool, and platform security features that combine automated and integrated workflows into a single point of access.
That way, druggies can upgrade each stakeholder’s experience and use their tool as an “ ultimate listening system.” Since robotization is getting decreasingly important in our data- driven age, Qualtrics has also developed drag-and- drop integrations into the systems that companies formerly use similar as CRM, marking, or messaging, while enabling druggies to deliver automatic announcements to the right people.
This point works across brand shadowing and product feedback as well as client and hand experience. Other critical features similar as the directory where druggies can connect data from 130 channels ( including web, SMS, voice, videotape, or social), and Qualtrics command to dissect unshaped data will enable druggies to use their prophetic analytics machine and make detailed client peregrinations.
If you ’re looking for a data logical software that needs to take care of request exploration of your company, Qualtrics is worth the pass.
Data wisdom platforms
Data wisdom can be used for utmost software results on our list, but it does earn a special order since it has developed into one of the most sought-after chops of the decade. No matter if you need to use medication, integration or data critic reporting tools, data wisdom platforms will presumably be high on your list for simplifying logical processes and exercising advanced analytics models to induce in- depth data wisdom perceptivity. To put this into perspective, we will present RapidMiner as one of the top data critic software that combines deep but simplified analysis.
RapidMiner KEY FEATURES
A comprehensive data wisdom and machine literacy platform with further than 1500 algorithms Possible to integrate with Python and R as well as support for database connections (e.g. Oracle)
Advanced analytics features for descriptive and conventional analytics RapidMiner is a tool used by data scientists across the world to prepare data, use machine literacy and model operations in further than 40 000 associations that heavily calculate on analytics in their operations.
By unifying the entire data wisdom cycle, RapidMiner is erected on 5 core platforms and 3 automated data wisdom products that help in the design and emplace analytics processes. Their data disquisition features similar as visualizations and descriptive statistics will enable you to get the information you need while prophetic analytics will help you in cases similar as churn forestallment, threat modeling, textbook mining, and client segmentation. With further than 1500 algorithms and data functions, support for 3rd party machine literacy libraries, integration with Python or R, and advanced analytics, RapidMiner has developed into a data wisdom platform for deep logical purposes. Also, comprehensive tutorials and full robotization, where demanded, will insure simplified processes if your company requires them, so you do n’t need to perform homemade analysis.
If you ’re looking for critic tools and software concentrated on deep data wisdom operation and machine literacy, also RapidMiner should be high on your list.
DATA CLEANSING PLATFORMS
The quantum of data being produced is only getting bigger, hence, the possibility of it involving crimes. To help judges avoid these crimes that can damage the entire analysis process is that data sanctification results were developed. These tools help judges prepare their data by barring crimes, inconsistencies, and duplications enabling them to prize accurate conclusions from the data. Before sanctification platforms were a thing, judges would manually clean the data, this is also a dangerous practice since the mortal eye is prompt to error. That said, important sanctification results have proved to boost effectiveness and productivity while furnishing a competitive advantage as data becomes dependable. The sanctification software we picked for this section is a popular result named OpenRefine.
OpenRefine KEY FEATURES
Data discoverer to clean “ messy” data using metamorphoses, angles, clustering, among others Transfigure data to the format you ask, for illustration, turn a list into a table by importing the train into OpenRefine Includes a large list of extensions and plugins to link and extend datasets with colorful web services Preliminarily known as Google Upgrade, OpenRefine is a Java- grounded open- source desktop operation for working with large sets of data that needs to be gutted. The tool also enables druggies to transfigure their data from one format to another and extend it with web services and external data.
OpenRefine has a analogous interface to the one of spreadsheet operations and can handle CSV train formats, but all in all, it behaves more as a database. Upload your datasets into the tool and use their multiple cleaning features that will let you spot anything from redundant spaces to duplicated fields.
Available in further than 15 languages, one of the main principles of OpenRefine is sequestration. The tool works by running a small garçon on your computer and your data will noway leave that garçon unless you decide to partake it with someone differently.
Data visualization tools & platforms
Data visualization has come one of the most necessary rudiments of data analytics tools. However, there’s presumably a strong chance you had to develop a visual representation of your analysis or use some form of data visualization, If you ’re an critic. Then we need to make clear that there are differences between professional data visualization tools frequently integrated through formerly mentioned BI tools, free available results as well as paid charting libraries. They ’re simply not the same. Also, if you look at data visualization in a broad sense, Excel and PowerPoint also have it on offer, but they simply cannot meet the advanced conditions of a data critic who generally chooses professional BI or data viz tools as well as ultramodern charting libraries, as mentioned. We’ll take a near look at Highcharts as one of the most popular charting libraries on the request.
Highcharts KEY FEATURES
Interactive JavaScript machine for maps used in web and mobile systems Designed substantially for a specialized- grounded followership ( inventors) WebGL-powered boost module to render millions of datapoints directly in the cybersurfer Highcharts is a multi-platform library that’s designed for inventors looking to add interactive maps into web and mobile systems. This charting library works with any reverse- end database and data can be given in CSV, JSON or streamlined live.
They also feature intelligent responsiveness that fits the asked map into the confines of the specific vessel but also placesnon-graph rudiments in the optimal position automatically.
Highcharts supports line, spline, area, column, bar, pie, smatter maps and numerous others that help inventors in their online- grounded systems. Also, their WebGL-powered boost module enables you to render millions of datapoints in the cybersurfer.
As far as the source law is concerned, they allow you to download and make your own edits, no matter if you use their free or marketable license. In substance, Principally, Highcharts is designed substantially for the specialized target group so you should familiarize yourself with inventors’ workflow and their JavaScript charting machine.
If you ’re looking for a further easy to use but still important result, you might want to consider an online data visualization tool like datapine.
3) Crucial Takeaways & Guidance We’ve explained what are data critic tools and gave a brief description of each to give you with perceptivity demanded to choose the one (or several) that would fit your logical processes the stylish. We concentrated on diversity in presenting tools that would fit technically professed judges similar as R Studio, Python, or MySQL Workbench. On the other hand, data analysis software like datapine cover needs both for data judges and business druggies likewise so we tried to cover multiple perspectives and skill situations. We hope that by now you have a clearer perspective into how ultramodern results can help judges perform their jobs more efficiently in a less prompt to error terrain.
To conclude, if you want to start an instigative logical trip and test a professional BI analytics software for yourself, you can try datapine for a 14- day trial, fully free of charge and with no retired costs.
Data analysis is one of the most important tools that companies use to make better, informed business opinions. In this composition, we’re going to look at some of the most popular data analytics tools on the request. Then are some of the most popular data analytics tools Data analysis is a complex and ever- changing field and there are numerous tools available to help you with this task. R is one of the most popular programming languages on the request moment. Python is one of the most popular programming languages in the world and is used by thousands of inventors around the world. Then’s a list of the top 10 business intelligence (BI) tools that you should consider buying if you’re working in the data analytics assiduity.
Business Analyst Roles and Responsibilities, job description and duties, Salary and benefits
Let us discuss Business Analyst Roles and Responsibilities, job description and duties, Salary and benefits about With growing competition and hunger to be the best in industry there is a need for consistent performance and perseverance to achieve the success in business.
Data beats feelings. Still, data also causes feelings. Especially negative feelings if your data does not give any practicable perceptivity on the subject. Data mapping and its indecorous perpetration are the most significant reasons behind point less insights. The lack of unified criteria and naming conventions across different data sources makes it hard for judges to see a holistic picture of business conditioning and make data- driven opinions. Without formalized perceptivity and multitudinous data disagreement all the time spent on data aggregation may be wasted in vain. This problem most explosively manifests itself in digital advertising, where different marketing tools have different names for the same metric. Ultimately, companies can’t find an operation to their data.
A recent study by Inc plant that over to 73 of company data goes unused for analytics. In this post, you’ll learn what data mapping is, how it solves data analytics issues, and what data mapping tools help non-technical judges gain demitasse clear insights.
As a Business Analyst, what is data and what are the fields in old system and New System for migration projects.
What is data mapping?
Data mapping is a process of matching fields from different datasets into a schema. The data mapping process identifies the target (for illustration, data storehouse table) data element for each source element (for illustration, transactional system).
Data mapping is the first step for a variety of different tasks, similar as Data migration Data transformation Data ingestion Merging of multiple datasets or databases into a single database. While moving information from one source to another, data specialists have to ensure that the meaning of information remains the same and applicable for the final destination.
In other words, data mapping helps databases talk to each other. Let’s consider the illustration of marketing metrics. Marketers frequently need to gather information from Google Analytics and Google Search Console in one place. These tools keep information about new druggies coming from Google in their own database. However, you’ll have to count the same caller doubly, If you just combine data from both sources. That’s why you need to produce a data chart that connects Google sessions in Google Analytics and clicks from Google Search Console. In this way, you can avoid duplications and fill your new database with precise data.
How to do data mapping?
To understand how data mapping works, we first have to figure out what data models are. A data model is an abstract model that describes data rudiments are arranged and how they relate to each other and other entities. Here are some of the most common data models Since there is no unified way to organize data in different models, data fields in two separate datasets might have distinct structures. But why do we need to know the way data is arranged in databases and how different datasets relate to each other?
Imagine that your company used a particular CRM system for a long time, but now it can’t manage with your requirements, and the company migrates to another solution. Likely, your new system habit have the same data format as your old bone. The new system might contain new data fields, naming conventions, and fields order.
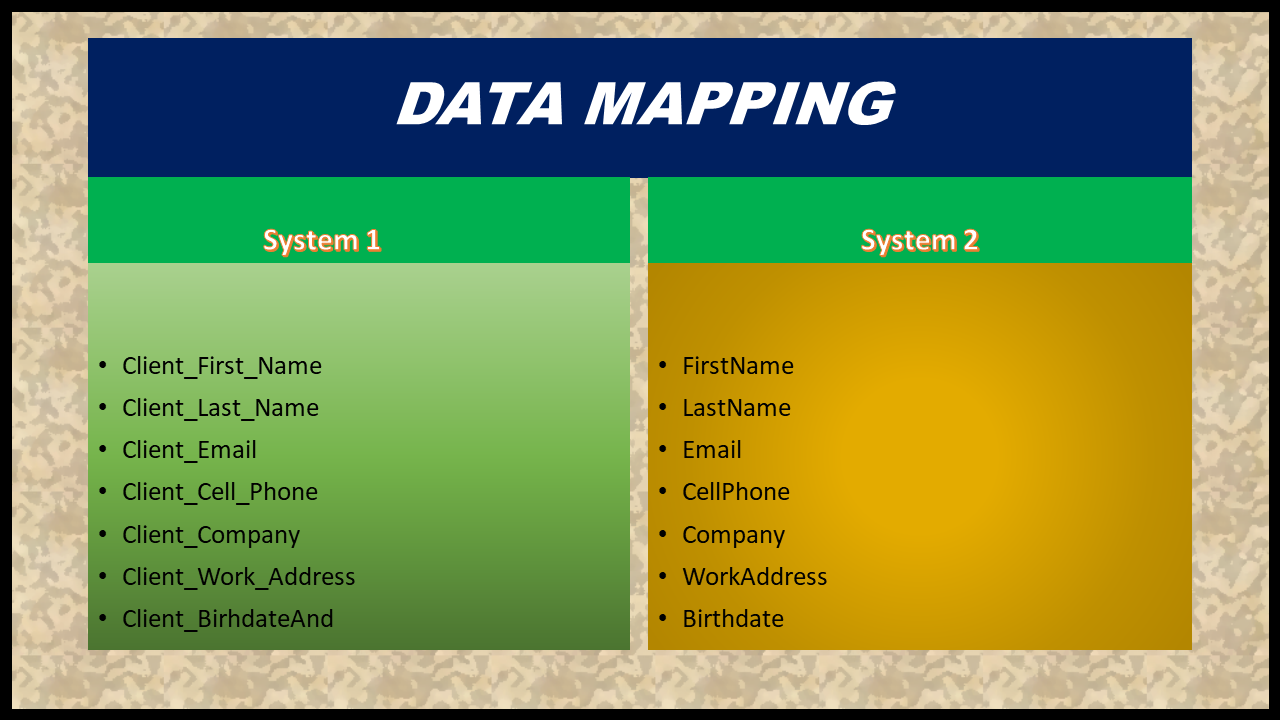
While the former result stored data in the following format Client_First_Name, Client_Last_Name, Client_Email, Client_Cell_Phone, Client_Company,Client_Work_Address,Client_BirhdateAnd your new result might have the following data formatting Last Name, First Name, Company, Work Address, Cell Phone, Birthdate, Email.
As you can see, these results have different data structures and naming conventions. In this case, copy pasting information would do no good. That’s where data mapping comes to help. With the help of a data chart, you can produce a set of rules which will make the data migration smooth and successful.
Here’s how data mapping between two CRMs works. These rules govern the data migration workflow in the following way.
Take the data from the first field of the old CRMs database and put it into the alternate field of the new CRM’s database.
Take the data from the alternate field of the old CRMs database and put it into the first field of the new CRM’s database. And so on Of course, these rules should also consider variables data types, the size of the data field, Â data fields names, and other details. But this illustration gives a high- position understanding of how data mapping works in mortal terms.
Data mapping advantages
The major advantage of data mapping is egregious judges get well-structured, analysis-ready data in the asked destination by mapping out your data. But what it gives you on a grander scale, and how it benefits your business? Let’s find out.
Three crucial benefits of data mapping tools Common data language. With data mapping, businesses achieve a grainy of their performance. Let’s take marketing platforms as an illustration. Every marketing platform has its own picking conventions for the same metric. Hence, every platform calls the same metric in different ways. Impressions, views, imps, imp are different names for the same criteria used by different tools.
Analysts can unify criteria from colorful sources to aggregate them in a single marketing report with data mapping. That’s how marketers can get a holistic view of the crusade performance and make the right opinions faster. This use case also applies to deals brigades, reclamation brigades, and other departments that use numerous data sources in their day-to- daywork. Recommendation systems Data mapping is one of the crucial factors behind behavior are targeting.
 Businesses similar as Amazon excerpt precious perceptivity from druggies browsing habits, purchase history, time spent on a runner, viewing history, and other data. Then, data specialists connect these perceptivities with other stats similar as demographic information or druggies purchase power.
By combining data from these sources, Amazon can target druggies with certain products and epitomize shopping gests grounded on a number of factors (e.g., challenges guests may be facing, their position, age, interests, education, occupation, and numerous further).
Still, to get the real value out of plain information, data experts must invest considerable sweats in data mapping because of data heterogeneity. Lead attribution Companies can track where their prospects come from and what marketing channels are the most effective by making your perceptivity talk to each other. With data mapping, marketers align criteria from different sources and combine them together. With data from analytics platforms similar as Google Analytics or Mixpanel and data from CRM systems similar as Hubspot or Shopify advertisers identify which data should be credited for each conversion. This data- driven criterion model gives a more accurate view of marketing performance and allows for better allocation of advertising budget.
Once you updated your profile in portals, ensure to update the profile frequently. Always recruiters prefer for updated resumes only. Ensure to update before business hours.
Tips to update the profile in Job portals:
Heading:
Resume Headline plays a very important role in short listing your resume by the Recruiters. Concentrate on Resume Heading and ensure it should proper.
Ensure to add all your Key skills, for example you are applying for Business Analyst then skills as below.
Business Analysis, Documentation, Prototyping, User stories, Requirements Analysis etc..
If you have strong domain knowledge on any particular domain then you should mention the same also. Ex : Banking, Healthcare, Telecom etc.,
Update your Resume
Update your resume frequently, at least weekly twice or thrice. So not think to much to update your resume i.e., what to update and all. Just modify any simple data and click on update.
Certifications:
Ensure to update the certifications if you have any, it will add benefit to your resume. Some organization will look for certified candidates only.
Identity
Add your photo to your profile.
Provided these Free Job Portals from various channels and based on my Experience.
I want to talk about what is SanityTesting and who will do the sanity testing and few advantages by performing SanityTesting. There are many testing methods; SanityTesting is one of the method.
Topics Covered
1. What Is SanityTesting?
2. Who will do the SanityTesting?
3. The Best Way To Do SanityTesting?
4. SanityTesting Steps
5. Advantages Of SanityTesting
1. What Is SanityTesting?
In SanityTesting, once development is completed, build will be generated and same will be released for testing. User tests the functionality of the software build, whether the functionality is working as per requirement or not. User tests whether critical functionalities are working or not. In simple terms we can tell, Sanity Testing focuses on testing specific functionality after making changes to the code and fixing any bugs.
The aim is to make sure that any reported bugs have been fixed and that the specified functionality works correctly.
2.Who will do the Sanity Testing?
It depends on the organization, in some organizations Business Analyst will do the SanityTesting to ensure no bugs or less bugs in application. It helps Business Analyst to understand the Application functionality.
Here we need not to execute all the test cases, we can test some important and critical test cases. Or else we can review the test case results if this is done by QA team.
3. The Best Way To Do Sanity Testing
As we discussed in above point, it is up to the team and organization that how to perform sanity testing. There is no particular method or document to perform sanity testing.
As we discussed there is no particular order or steps to perform SanityTesting. But we will try to follow some tips to ensure critical functionalities of the application are working.
Identify : First understand the requirement and functionality of the application. Then identify what needs to be tested. It is required for any type of testing. This includes functionality, features, and modifications that were introduced to the relevant code or build.
Validate : The testers will check and validate all of the identified functionality, features, and modifications from the above step.
Testing : Team will test all the functionalities, features and modifications from the above step. This ensures that application functionality is working as expected.
5. Advantages Of Sanity Testing:
As team tested end to end functionality, it helps to avoid escalation from the client.
As functionality has fewer bugs or no bugs, it improves client satisfaction.
As team tests on concentrated functionality, it is easy to identify the bugs.
There are many testing methods, Functional testing, and integration testing (SIT), Black box testing, regression testing, smoke testing and all.
I want to discuss about what is a BRD and how to prepare BRD?
Topics Covered in this Article:
What is a BRD or Business Requirements Document?
Who will prepare the BRD and who is Responsible for BRD?
Objectives of a business requirement document?
Business Requirements Document- Key elements
How to prepare BRD?
Business Requirement Document Template – Sample Template.
Tips for writing a business requirements document?
What is a BRD
1.What is a BRD or Business Requirements Document?
BRD is a Business Requirement Document, in some organizations it is also called as Business Requirements Specifications Document. By seeing the name we can understand in this document we will capture all the requirements and how we are going to provide solution to the client. We can say it is the communication document between Business and Technical Team.
In simple words we can say, BRD indicates what the business wants to achieve. The BRD indicates all the project deliverable and the inputs and outputs associated with each process function. This document will have customer needs and expectations.
BRD definition: “A Business Requirement Document (BRD) focuses on the business perspective as it holds the details of the business solution for a project.”
2.Who will prepare the BRD and who is Responsible for BRD?
Business Analyst prepares this document with the help of respective stakeholders. While creating Business requirements document, we should include the project stake holders, and the Business stake holders, that means we should invite or include all the stake holders who are needed to complete this project smoothly.
In some organizations client prepares the BRD and share with IT organization to deliver their changes or requirements, once IT team receives the BRD then they will do the feasibility analysis and release FSD or FRD based on the BRD.
Who should be involved in business requirements document creation?
A number of teams and partners should create the BRD:
Core team of the project (BA, Development Team, QA and all)
Business partner’s or stake holders
Process owner(s) or representatives
Subject matter experts
Change/project/product management, quality department and/or IT management as needed or available
Change Management Team.
3. Objectives of a business requirement document?
To get an agreement and common understanding among all the stakeholders
Communicate to the technology server provider, the business needs, the customer needs, and what the solution needs to provide to satisfy business and customer needs
Describe in details of the customer needs or requirements.
Describe clearly what solution we are going to provide.
4.Business Requirements Document- Key elements
A Business Analyst or Project Manager prepares the Business Requirement Document as they have good understanding on the client requirements and if there is any ambiguity or clarification required from client, then they are the persons can reach the Business stake holders.
The most important and critical component of a Business Requirement Document is the scope of the project. We (Project Managers and Business Analysts) should understand the restrictions and constraints.
Why project initiated
What is the goal or objective of the project?
What are the problems which the business wants to solve?
What are the restrictions?
What are the limitations?
Is it worth to invest the time and money required for the project?
5.How to prepare / Business Requirement Document BRD?
We should take care of few important things before creating BRD.
We should define the need or requirement of the company or organizations.
We should ensure all the stake holders involved.
We should identify the phases of the project.
We can use a suitable template to capture the requirements.
6. Business Requirement Document Template – Sample Template.
Document revision
Approvals
Introduction
Business goals and objectives
Stake holders
Business rules
Project background
Project objective
Project scope
In-scope functionality (Requirements)
Out-scope functionality (Requirements)
Business requirements
Data requirements
Functional requirements
Non_functional requirements
Assumptions
Constraints
Risks
Business process overview (modeling diagrams for instance, Use Case and Activity Diagram)
Legacy systems
Proposed recommendations
List of acronyms
Glossary of terms
Related documents
Dependencies of existing systems
This document may vary depends on the organizations, some organizations may have their own template and format. If no standard template or format not available in your organization then you can use the suitable template as per your client requirements.
7.Tips for writing a business requirements document
Here I am trying to give some simple tips to write Business Requirement Document.
Engage stakeholders:Encourage all the project stakeholders to get involved in elicitation techniques such as brainstorming, surveys, focus groups, interviews, and ideas for prototyping.
Include mockups:Include visuals and graphical representations, such as charts and diagrams, when necessary, as they can be powerful in making your point. We can use so many open source tools to draw diagrams and to create process flow diagrams and charts.
Do feasibility research:Research some of the past projects to determine the feasibility of your BRD. Evaluate your project to understand whether the solution desired can be developed within the constraints of time & cost.
Use Simple Language:Don’t use complex words rather use simple easy to understand language that encourages action.
Validate the Document and contents:After writing the business requirements document, have it reviewed thoroughly before distribution. Obtain validation of the information and the contents–including the assumptions–and ensure that all errors are corrected.
I want to discuss about RACI Matrix, what RACI Matrix is and what the advantages are by using this in this article.
What is RACI Matrix
Topics Covered in this Article:
What is RACI matrix?
What is a RACI chart?
What does RACI stand for?
RACI definitions
Advantages of a RACI chart
When to use a RACI matrix
How to create a RACI matrix: Example & template
RACI matrix rules
What is RACI matrix?
I will try to explain in simple words, when we are working in an organization or in a project, we should know who Responsible is for what tasks and who is Accountable. It helps to track the project that particular task is pending with whom or assigned to whom. So to understand that, will prepare RACI chart.
What is a RACI chart?
A RACI chart is a simple matrix used to assign roles and responsibilities for each task, or decision on a project. By clearly mapping out which roles are involved in each project task and at which level, you can eliminate confusion and answer the project question, who’s doing what?
What does RACI stand for?
RACI stands for Responsible, Accountable, Consulted, and Informed. We can observe each letter represents the tasks responsibility.
RACI definitions
Responsible: Team member does the work to complete the task. Every task needs at least one Responsible member, but as per project we can assign more.
Accountable: This member assigns the work. And this member reviews the completed task before delivery. On some tasks, the Responsible party may also serve as the Accountable We should ensure to each task should assign to one Accountable person.
Consulted: These members provide inputs based on their domain experience or knowledge. They can also provide inputs on how it will impact on future project.
Informed: These team members simply need to be marked in the loop on project progress.
Advantages of a RACI chart
A RACI matrix helps us to set clear expectations about project roles and responsibilities.
It helps us to avoid multiple people work on same task.
When to use a RACI
If you want to know who is performing which task then RACI will help you to understand easily. It avoids the confusion in team.
The decision-making or approval process could hold up the project.
There’s conflict about task ownership or decision-making.
The project workload feels like it’s not distributed evenly.
And please understand we need to create RACI matrix based on the project and team. This is not same for all the projects and teams. We need to assign the roles as per our requirement and our project.
How to create a RACI
We can create a RACI matrix easily and quickly with using Excel. We need not to learn any new software or technology to create RACI matrix. However we need to understand the roles and who is going to own that particulars tasks to prepare.
Enter all project roles or team member names across the top row.
List all tasks, milestones, and decisions down the left column.
For each task, assign a responsibility value to each role or person on the team.
RACI chart Example
RACI Rules.
Once your RACI chart is complete, review it to be sure it follows these simple rules:
Every task has at least one Responsible person.
There’s one (and only one!) Accountable party assigned to each task to allow for clear decision-making.
No team members are overloaded with too many Responsible tasks.
Every team member has a role on each task.
If we have a lot of Consulted and Informed roles on our matrix, then we can share the common link to access the project.
In simple words we can say wireframe is a diagram, Team use this diagram to understand how the developed product should be. It helps to internal and external stake holders to understand the same.
If we have good skills, then we can create mockups and proto types also for better understanding and it provides clear picture to the team.
Sample BA Document Templates
FREE DOWNLOAD
Send download link to:
2.When wire-frames to be created?
The wireframes or mockups or prototypes should be created before the software development is started. It helps to minimize rework and save the resource time.
If we are following waterfall methodology then wireframes should be created before development stage.
It does not matter how we are preparing the wireframes but ensure it is important that the wireframe designer (UI/UX designer), understands the information that has to be displayed on the screen.
The designer or UI developer has to really understand how the user will interact with the system. If they understand clearly what is the requirement then only they can prepare the wireframes.
So it is very important that requirements should be gathered properly before creating wireframes.
As we discussed in previous articles requirements can be gathered with using multiple elicitation techniques and same will be documented in relevant artifacts.
As requirements will be updated as User Stories or use cases, same will help to design the wireframes.
3.Advantages of Wire-frames.
a.By using wire-frames we can prevent the rework.
b.It saves resources time.
c.Wire-frames are easy to use and understand.
d.It avoids the confusion and misunderstanding within the team members.
e.Wire-frames are used by the team to have a share understanding of the same information.
f.Wire-frames are used to help design the user interface.
g.Coding (Technical) skills not required.
4.How to create wire-frames?
There are tools available to create wire-frames. Some of the tools are free and open source; we can use the same to create wire-frames.
And even with using paper and pencil also we can design the wire-frames; or by using white board and pen also we can create the wire-frames, the ultimate goal to create wire-frame is make developers to understand what and how the screen should be.
But using software also has advantages such as data storage, data retrieval and wire-frame reusability. If we use software then we can use this wire-frames in future also when ever required.
To properly create the wire-frames, we need to understand what the buttons to be available in screen are and what the functionality is. And we need to understand what fields to be available on the screen.
By using some open source tools we can create the wire-frames even if you do not have the coding skills.
5.Why wire-frames are required?
There are so many ways to document the requirements and make development team to understand, but wireframes will help to understand the requirement clearly. Wireframes are easy to draw and easy to understand.
FAQ’s
What are wireframes in design?
The designs you received are called wireframes (sometimes called wires, mockups, or mocks). A wireframe is a schematic, a blueprint, useful to help you and your programmers and designers think and communicate about the structure of the software or website you’re building.
What is the use of wireframe?
A wireframe is commonly used to lay out content and functionality on a page which takes into account user needs and user journeys. Wireframes are used early in the development process to establish the basic structure of a page before visual design and content is added.
What are wireframes and mockups?
A mockup is a static wireframe that includes more stylistic and visual UI details to present a realistic model of what the final page or application will look like. A good way to think of it is that a wireframe is a blueprint and a mockup is a visual model.
What should wireframes include?
A wireframe is a two-dimensional illustration of a page’s interface that specifically focuses on space allocation and prioritization of content, functionalities available, and intended behaviors. For these reasons, wireframes typically do not include any styling, color, or graphics.
What are the different types of wireframes?
There are three main types of wireframes: low-fidelity wireframes, mid-fidelity wireframes, and high-fidelity wireframes.
Is Wireframing UX or UI?
Wireframing is a practice used by UX designers which allows them to define and plan the information hierarchy of their design for a website, app, or product. … Without the distractions of colors, typeface choices or text, wireframing lets you plan the layout and interaction of your interface.
What is an API? (Application Programming Interface)
What is an API
API is the acronym for Application Programming Interface. In simple words we can say it is the communicator between two software applications. It allows software applications to talk each other.
Every day we are interacting with the multiple applications which are integrated with other applications. Example : Amazon, Flipkart, Phonepe etc.. It means every day we are using an API but the thing is we do not know that this is API.
Let us try to discuss and understand what an API with using some examples. I feel by using examples we can understand what is an API is.
For example some applications will allow you to login and use application with using gmail account. And for some applications which will allow you to login and access the application by using your Facebook account.
It means that applications have integration with gmail and Facebook. Here these two applications talk each other and how the request should be and in which format they are expecting request from the sender.
We will discuss in detail with another example to understand what is an API? :
What Is an API and Example?
For example I want to book train tickets, to book train tickets I need not go to IRCTC portal. If you observe by using other applications also we can book the tickets. So here we can understand these two applications are talking each other to execute your request.
Here the main concept is to understand is “Request and Response” How we need to pass the Request and how we are going to get response.
Or how we will give the response and how we are expecting request to give correct response.
If you observe our website, if you register with your email id you will get the immediate response or message. To send email messages I am using some other applications means I am using API to pass values as per their request.
Let us observe one more example which we are using on daily basis to make you understand what is an API in detail.
Here is a real-life API example. We will search for flights online to check the availability and all. We will have a multiple options to choose from, including different cities, departure and return dates, and more.
Let us imagine that you’re booking you are flight on an airline website. You choose a departure city and date, a return city and date, cabin class, as well as other variables.
In order to book your flight, you interact with the airline’s website to access their database and see if any seats are available on those dates and what the costs might be.
However, what if you are not using the airline’s website–– and you are using some other applications to book the tickets. As all you know now days we are using multiple applications to book flight tickets or some other needs.
The travel service, in this case, interacts with the airline’s API. The API is the interface that,, can be asked by that online travel service to get information from the airline’s database to book seats, baggage options, etc.
The API then takes the airline’s response to your request and delivers it right back to the online travel service, which then shows you the most updated, relevant information.
Software developers or organizations are using below API’s
SOAP Service (API)
REST API (Service)
Developers will write code and use json format or .xml format to form request and response.
As a Business Analyst you need not have deep knowledge on this like how to write code and how developers frame request and response in json or .xml format. But you should have at least knowledge to how to understand the request and response. It helps you to understand based on the response received.
For example any application or website down usually we receive message as “404 error” based on this response or message we can understand website is down.
I hope it helped you to provide a overview about what is an API?
If you want to know more about what is an API and how to develop API, you can browse on google to understand. Enough material is available in google and youtube.
For Business Analyst perspective it provides overview on what is an API ?
Root Cause Analysis is very important it helps us to understand on below. You may have the doubt that what is root cause analysis and who performs the Root cause Analysis, Let us observe below.
What is the issue?
How to prevent these types of issues in future?
Why this issue occurred?
What steps could be taken to not to occur this issue?
What are the preventive actions?
Getting into the roots helps in removing the main cause of the defects.
The RCA helps in getting the exact reason of the problem?
What is a Problem?
An incident which impacts the smooth flow of the process is termed as Issue. And same issue is occurring again and again and impacts the smooth functioning of the application and impacts the business then it termed as problem.
Then we need to perform Root cause Analysis to identify why this issue is happening again and again. Sometimes client also expects RCA document from us.
Usually RCA document contains below.
What is the issue?
Why it happened?
How you fixed that Issue?
What preventive steps to be taken to not to repeat the same issue in future?.
When RCA or RootCause Analysis is required?
Usually RCA is needed when same incident is happening again and again and it is impacting the smooth functioning of the application.
For the smooth functioning of the processes, it is necessary to identify the Root cause of this particular issue and how to prevent the same issue in future.
RCA should be performed as soon as issue or defect identified so that it helps to avoid major problems in future.
Depends on the issue and situation it is suggested to involve the stake holders while conducting the RCA. Because sometimes issue may occur due to misunderstanding of the application functionality.
Stake holders help in getting away from the fictionalization of the facts.
Before accepting or committing any requirement, as a Business Analyst, first we need to do the feasibility study, during (feasibility study) analysis we need to concentrate on below.
The requirement is feasible or not.
Whether it will impact any existing functionalities.
Whether this requirement may cause to any performance issues.
Whether this requirement fits in the current system or not.
What are the dependencies on this requirement?
What are the integration points?
Any impact on integration points?
You can discuss with internal and external stakeholders to understand the requirement clearly, if we not understand requirement clearly, then there is a chance to miss out some functionalities. It may lead to system issues/ bugs or client escalations.
If we delivered defect product then client will not happy and they may lose confidence on us. So it is very important to understand the requirement clearly before committing to client.
A Analysis is a preliminary analysis of solution alternatives or options to determine whether and how each option can provide an expected business benefit to meet the business need or requirement.
A Analysis may address either a business problem to be resolved or a business opportunity to be exploited.
We can do the feasibilitystudy based on the resource and data available with us. Some tools also can be used to do the feasibility study.
The feasibilitystudy is an integral part of formulating a major business transformation project. Eg. Re-engineering a core business process and supporting technology, establishing a new line of business, increasing market share through acquisition, or developing a new product or service.
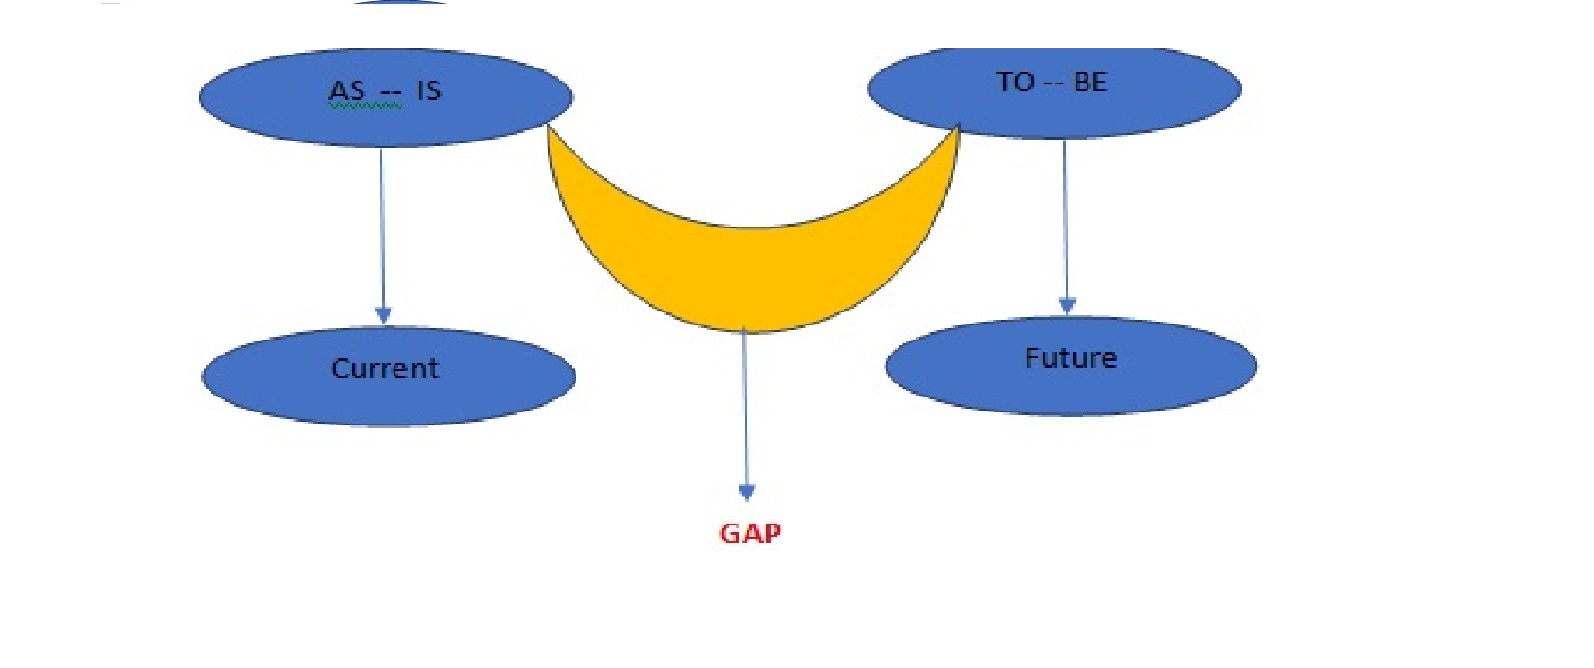
What is the GAP Analysis and why it is important? GAP means the difference between Current state and future state.
Who performed GAP Analysis?
This is a process performed by Business Analysts and Project Managers. The difference between the current process and future process is known as GAP. This help us to understand where we are (Current State) and where do we want to be (Future State)?
This helps us to measure investment of time, money and human resources required to achieve a particular outcome or desired outcome.
There is no formal method to conduct (GAP) Analysis. It depends on organization to organization and process to process. A simple excel sheet can be used to for this purpose. The main objective of the (GAP)analysis is to provide difference between current state and future state or desired state.
Key Points :
Good understanding of the current process.
All the business affecting factors must be well defined.
GAPanalysis is an assessment tool used to find the deviation or gap between what exists versus what is needed or desired.
No ambiguity in the requirements and future prospects.
Document the gaps using graphs, charges and images.
Ensure to include the feedback from the stakeholders.
Ensure to inform to all the involved parties or stakeholders about the identified gaps.
Different stages in GAP Stages
Review System
Develop Requirements
Comparison
Implications
Recommendations
This is one of the best procedures followed by any organization to improve the process and recognize the processes which needs improvement.
UseCase diagrams plays very important role, these diagrams help to understand the relationship between user to user and user to system. Like what is the relationship with the user and what are the actions done by the User and how user wants to interact with the system.
The focus of this diagram will be on “how external interfaces” (End users, Support systems, Database and internet connectivity to third party) will be interacting with the Proposed IT System.
Use Case Diagram contains below:
Use Case will be as below:
2. Actor:
3. Use Case System Boundary.
4. Lines to match the Activity with the user:
Relationships between Actors and Use-Cases
Use-cases could be organized using following relationships −
Generalization
Association
Extend
Include
Where and Why Use Case Diagrams can be used:
Describe the functionality of a System
Describe the user Actions
Use case diagrams represents only positive flow.
Should not use for alternate flow, like if any error happens what to be done.
To describe how user interacts with the system.
To describe how external interfaces, interact with the proposed system.
Actor and use case play important role.
Lines represent the relationship between Actor and Use Case (Oval Shape).
Information which we should not use in use case diagrams.
Technology Names (Java, .Net Mainframes)
Brand Names ( Lenovo, Sony etc..)
Data Base Names (SQL, MySQL, Oracle etc..)
Networks (LAN, WAN etc.,)
Architectures (2 Tier, 3 Tier etc..)
Name of the systems (Laptop/ Desktop)
Actor :
Actor stay away from the system boundary.
Primary actor initiates the system to work.
System depends on secondary actor for information.
Reusable actors will be placed right side of the system boundary.
How to draw Use Case diagram
Write all sequence of Actions.
Differentiate information against Actions.
Try to find out which actor is performing which action.
Try to find out some modules with respect to functionality or usage.
Try to draw the relationships between the identified Actors and use Cases
Once completes the Use case diagram then we will prepare use Case Specification Document. This is also called as Use Case description Document. This document helps to provide the clear picture of the Use Case Diagram.
UseCase Specification document contains below.
Name of the Use Case
Description of the Use Case
Actors
Primary
Secondary
Basic flow
Pre-Conditions
Post conditions
Assumptions
Dependencies
Constraints
Input and output
Miscellaneous information.
Alternate Flow.
We can’t tell which use case diagram is correct and which use case diagram is wrong. It depends on the project and stakeholders.
How to Derive Test cases.
UseCase Diagram
UseCase Description Document
UseCase specification document will have, Basic flow, Alternate flow and description of the use cases.
We can identify the scenarios from these flows.
Try to identify 3 to 5 valid test data from each scenario.
Then try to write the test cases from the gathered test data and scenarios.
JAD sessions is also one of the important elicitation technique used by the Business Analyst to gather and understand the requirements.
Let us see what is JAD session, Joint Application Development (JAD) is a process used to collect business requirements while developing new Software systems for a organization. The goal of a JAD session is to gather in subject matter experts/Business analyst or IT specialist to bring out solutions.
A Business analyst is the one who interacts with the entire group or different teams and gathers the information/ Requirements, analyses it and brings out a document. He plays a very important role in JAD session.
Why JAD Sessions required?
Meeting and collaborating with Business and Technical team, JAD sessions are very common in Business Analysis Role. Particularly when we are working in Agile Methodology.
For example, Technical team need some more clarity on Business Requirements then JAD sessions are required, in the same way if Business team needs more clarity on technology then JAD sessions are required.
Advantages :
It helps to clarify the doubts: As all the required staked holders joins the session, all doubts will be clarified in this session. Based on the requirement, Business Analyst may conduct multiple sessions with all the required stake holders.
Understand the requirements clearly: helps to understand the requirements clearly without any ambiguity.
Provide solution with less time. As all the stakeholders joins in this session, will get the solutions for the problems (requirements related issues or problems) in the same session.
Client satisfaction: As client is involved throughout the development process he knows what is happening and how project is going on. And as he gets the updates on project client also happy.
Development team also happy as all the teams joined in meeting their doubts or issues get clarified by the SME’s or client without delay.
It helps to faster delivery.
JAD Session enables customers and developers to quickly come to an agreement on the basic scope.
If any requirement is not feasible or any challenges to deliver the requirement, then they think for alternative approach. As the entire stake holders are part of this meeting, they can take a decisions accordingly.
Prerequisites:
Business Analyst should have clear agenda before scheduling the JAD Session.
Ensure to join all the required stakeholders (SME/ Dev.Team, internal and external stakeholders)
Ensure to discussion is going on in right track.
Ensure to conduct the meeting on stakeholders convenient time. As all the required teams to be joined in this meeting, it is the responsibility of organizer to collect all the teams and convenient time ensure to join all the teams in meeting.
Who all are participate?
Executive Sponsor
They normally are from higher positions, who can take decisions and drive the project.
Subject Matter Expert
These are the business users and subject experts. The subject matter experts are the backbone of the JAD session. They help to understand the functionality and they are required to fill the functionality gaps.
Facilitator
He/ She organizes the meeting; he/she identifies issues that can be solved as part of the meeting. The facilitator does not contribute information to the meeting.
JAD is used as a technique for developing business system requirements and is typically used in the early stages of a systems development project. The purpose of JAD is to bring together MIS and end users in a structured workshop setting; to extract consensus based system requirements.
How do you perform a JAD session?
Define the JAD Session Objectives. The first task for the facilitator, together with the project leader and other key individuals, is to define the session objectives. … Prepare for the Session. The facilitator has primary responsibility for JAD preparation. … Conduct the JAD Session. … Produce the Documents.
Coined by Bill Wake in his book Extreme Programming Explored, INVEST is an acronym that defines a simple set of rules used in creating well-formed user stories. An effective way to ensure testability is to define user acceptance criteria for all user stories. …
What is invest in user story?
Bill Wake came up with the INVEST acronym to help us remember guidelines for writing effective user stories: Independent, Negotiable, Valuable, Estimatable, Small, and Testable.
What are 3 C's in user stories?
Whether you are a newbie or a seasoned veteran, the 3 C’s of User Stories help keep the purpose of the user story in perspective. The first C is the user story in its raw form, the Card. … The second C is the Conversation. … The third C is the Confirmation.
What are the 3 pillars of Scrum?
The three pillars of Scrum that uphold every implementation of empirical process control are: Transparency. Inspection. Adaptation.
As a Business Analyst we need to understand the requirements clearly, to understand the requirements as a Business Analyst we need to use techniques to understand the requirements. Let us observe Business Analyst elicitation techniques.
Elicitation is the process of digging out the information from the stakeholders. Requirements Elicitation serves the foundation in documenting the requirements.
Requirements elicitation practices include interviews, questionnaires, user observation, workshops, brainstorming, use cases, role playing and prototyping. … Before requirements can be analyzed, modeled, or specified they must be gathered through an elicitation process.
What techniques do business analysts use?
S.W.O.T. stands for Strength, Weakness, Opportunities, and Threats. This is the most important technique used in business analysis. It is conducted by a group of people with different mindsets and perspectives in the company in order to access a changing environment and react accordingly.
What is elicitation in business analysis?
Requirements Elicitation. A Project’s Foundation
Requirements elicitation is the set of activities where information is given by stakeholders, users, and customers to be applied to the design of the initiative or the solution. Elicitation is a perpetual process during a project development.
What are the three main techniques of business analysis planning?
List of Best Business Analysis Techniques SWOT Analysis. The term SWOT stands for its four elements– … MOST Analysis. The term MOST stands for its four elements – … Business Process Modelling (BPM) … Use Case Modelling. … Brainstorming. … Non-functional Requirement Analysis. … PESTLE Analysis. … Requirement Analysis.
Which requirement elicitation is most popular?
Having said that, brainstorming, document analysis, interviews, prototyping and workshops are the most widely used requirement elicitation techniques.
Why is requirement elicitation a difficult task?
Why is Requirements Elicitation a difficult task ? Explanation: Users specify unnecessary technical detail that may confuse, rather than clarify overall system objectives. … Explanation: Requirements traceability provides bi-directional traceability between various associated requirements.
What is elicitation in teaching?
Elicitation is a technique by which the teacher gets the learners to give information rather than giving it to them. A teacher elicits the rules for the structure of the first conditional by asking learners to look at some examples, then writing ‘We make the first conditional in English with…?’ on the board.
Who are involving the project directly or indirectly are called as stake holders. Ex: Development Team, Testing Team(QA), client, SME’s and Architect. Stakeholder management is very important to gather the requirements.
And as a Business Analyst we have coordinate and arrange multiple meetings and interviews with multiple teams to understand the requirements and to deliver the requirements as per planned schedule.
As a business Analyst we are responsible for certain things like,
Investigation of requirements
Elicitation of requirements
Analyzing the requirements
Communicating with internal and external stakeholders
Documenting the requirements
Stakeholder Management/ Analysis
Business analyst role is continuous improvement, continuously we have to concentrate on our skills and we have to upgrade as per industry to survive or to prove as a Business Analyst. Always Business Analyst needs to think how things can be better, and how we can provide better service or support to the client.
When we are analyzing the requirement we should also think about the impact on existing functionality and what are additional things are needed to meet customer expectations.
When we are communicating product delivery dates to client, we should ensure that we have to deliver on time which includes design, development and testing and all internal approvals, before committing due dates we have to understand exactly what is the requirement and how much man hours needed and what are the challenges we may face during producing the product. Because if you are unable to release the product on committed dates then client may lose confidence on you, so it is difficult to handle further. Before committing dates you should concentrate on design, development issues, Testing and issues and what are the dependencies on other teams.
To understand the situation and complexity of the problem clearly we can do interview stake holders, it helps us to understand the problem clearly and client also feel team is working on their issue, so client also may happy. Once we understand the problem clearly then we need to spend time with the internal teams to resolve the issue.
To understand the requirements clearly we have to coordinate with stake holders and subject matter experts, Subject matter expect will explain to us what the exact business requirement is and how they are expecting the functionality of the application.
Sample BA Document Templates
FREE DOWNLOAD
Send download link to:
How to identify Stakeholders and How to get in touch with the Stakeholders: Stakeholder Management/ Analysis
Project Managers or Project directions can help us who are the stake holders and with whom we need to coordinately closely to understand the requirements clearly. Some of the stake holders are very important because they may impact on the project if they have any requirements.
Usually Project manager or Project director can decide who the stake holders are or in some of the cases stake holders can decide who can be the project manager. Project managers or Project directors should know who the stake holders are.
Once you start discussing with the stake holders then you can understand who can help us to understand the requirement clearly and what is the involvement of the stake holders in the project. Based on that you can identify and categorize the stakeholders.
Once you identify the stakeholders then we need to categorize them. Like..
How do they impact on the project.
What are their contribution on the project
What is the level of involvement and how do we need to communicate with them.
Once you get the requirements still you need clarity then you can discuss and coordinate with the Subject matter experts to understand the requirements in better way, but remember one thing, if we ask one question then subject matter experts will give multiple answers, then you need to pick the correct one which suits to your project and which is in scope. Scope like as boundary for us, if we cross the boundary then project manager may feel bad and it may impact on project delivery. Because it will impact on the budget, resources, scheduling and planning.
If you schedule any meeting with the stake holders, first you give overview of the project to the stake holders, so that we can expect the requirements within the scope. It will help us to keep them in control. Once you get the requirements, ensure the document it and get the sign off from the client.
Identify the stakeholders, Identify of level of contribution in project, create a relationship and build a trust among the stakeholders. Because if stake holders do not have confidence or trust on you then they may refuse to discuss with you, it may impact on requirements gathering, so it is very much important to build a trust among the stake holders.
I hope it helped you to provide the overview of Stakeholder Management.
To know more about stakeholder management, you can browse on google to get more information and idea.
Stakeholder management is the process of maintaining good relationships with the people who have most impact on your work. Communicating with each one in the right way can play a vital part in keeping them “on board.” This article is about how to communicate effectively with stakeholders.
What are the 7 principles of stakeholder management?
The 7 principles of Stakeholder Management! … Bucholtz and Carroll point out that the principles highlight action words that illustrate the spirit that should be used in engaging with stakeholders:
acknowledge.
monitor.
listen.
communicate.
adopt.
recognise.
work.
avoid.
What is an example of stakeholder management?
Examples include employees, customers, shareholders, suppliers, communities, and governments. Upstream stakeholders contribute to or approve the activities required to design, build and bring a product to market.
What are the 4 steps of stakeholder management process?
Four Steps to Stakeholder Relations
Identify Stakeholders. The first stage in stakeholder relations involves researching individuals and third-party organizations that may be relevant. …
Study Stakeholders. Once potential stakeholders have been identified, do your homework. …
Prioritize Stakeholders. …
Contact Stakeholders
What are stakeholder management techniques?
Five strategies for effective stakeholder management
Stakeholder mapping. Early in the project, conduct a thorough stakeholder analysis to identify your stakeholders. …
Influence is key. …
Identify the triggers. …
Look for opportunities. …
Proactive mitigation.
What are the 10 key principles of stakeholder management?
Key principles of stakeholder engagement
#1 Understand. …
#3 Consult, early and often. …
#4 They are human too. …
#5 Plan it! …
#6 Relationships are key. …
#7 Just part of managing risk. …
#8 Compromise. …
#9 Understand what success is.
What makes good stakeholder management?
Good communication keeps crucial stakeholders on board. Stakeholder management is the process of maintaining good relationships with the people who have most impact on your work. Communicating with each one in the right way can play a vital part in keeping them “on board.”
What is stakeholder management and why is it important?
Stakeholder management is an important activity that is used to gain mutual understanding of the objectives and expectations of all parties. It aids in developing a concept that will gain support from all the interested and affected parties enhancing the likelihood of a successful outcome
What is the objective of stakeholder management?
At its core, stakeholder management is the ability to create and maintain positive relationships through the appropriate management of individual needs, wants and expectations. Stakeholder management is a process that works best when planned and guided by underlying principles.
Why is stakeholder management skills important?
Stakeholder management is important since it is the lifeline of effective project relationships. This needs to involve establishing a sound relationship and understanding how their work is contributing to project success. You need to establish trust and maintain relevance
What is stakeholders management plan?
The stakeholder management plan defines and documents the approach and actions that will increase support and minimize the negative impacts of stakeholders throughout the life of the project. It should identify the key stakeholders along with the level of power and influence they have on the project
What is the first step for stakeholder management?
Stakeholder Analysis is the first step in Stakeholder Management, an important process that successful people use to win support from others. Managing stakeholders can help you, too, to ensure that your projects succeed where others might fail.
How do you build stakeholder management?
Six principles for building trusting stakeholder relationships
Seek first to understand before being understood. …
Have empathy and think in win/win solutions. …
Set a good example as a project manager and leader. …
Be honest and open about project progress. …
Be proactive and take responsibility for your actions.
What are the four types of stakeholders?
The easy way to remember these four categories of stakeholders is by the acronym UPIG: users, providers, influencers, governance
What are the five steps to stakeholder engagement?
5 Essential Steps to a Stakeholder Engagement Plan
Reduce project risks.
Manage your resources more effectively.
Facilitate team collaboration.
Gain buy-in.
Meet timelines.
Build trust and better relationships with stakeholders and communities.
Let us discuss about Tools used by Business Analyst
Tools Used by Business Analyst:
Business Analyst needs to use some tools during the project to make stake holders to understand the requirements clearly. Let us see some of the commonly and important Tools Used by Business Analyst:
A complicated BA role, Business Analyst needs to gather the requirements from the client and he needs to ensure that no requirement should be missed. He should prepare the specifications very carefully, because development team will understand the requirements based on the artifacts shared by the Business Analyst, if they understand in different way then development team will deliver what they understand as per the artifact, so it may not be as per client requirement, it leads to project failure.
Every organization is using different tools as per company’s requirement, here we will observe the commonly used to tools.
As a practicing business analyst, I have come across many business analysis tools.
I read so many articles and blogs in internet to understand what are the tools used by the Business Analyst to prove as a good Business Analyst. I found so many tools in internet, but practically it is very difficult to learn all the tools which I found in internet by the business analyst. Because A business analyst is one who deals with the requirements gathering, elicitation, analysis, and modeling on a day-to-day basis.
Hence, in this article, I focused on commonly Tools Used by Business Analyst which are used by almost all organizations.
Fundamentally, BusinessAnalyst need following types of business analysis tools:
To track requirements
To manage the requirements
Design the requirements
Describe requirements in certain detail
Model requirements wherever feasible
To collaborate with internal and external stake holders.
Here I am going to mention which are the tools I am using to meet my requirements, am not intended you to learn only these tools and am not promoting any tools.
MS Excel:
Mostly I use Excel to create flow charts and as per the client requirement, can use Excel to track the requirements and for requirement traceability matrix. We can create multiple things with using Excel like Wireframes, Flow charts and to manage the requirements. Excel contains several built-in mathematical and financial functions which will be useful in data analysis
Pivot tables
Examining the trends in data
Sort and filter data
Creating charts or graphs
MS Word:
Will use Ms_Word to prepare the multiple documents like FSD , BRD, Release Notes and User Manuals. Most of the stake holders are using the Ms-word to prepare multiple documents.
MS PowerPoint:
Will use power point for presentations. With using powerpoint we can easily explain to stake holders.
Google Search:
If you stuck somewhere and not able to understand what to do and how to do, then Google search will help us to get basic idea. If we need any templates related to documentation also we can get the same with using Google Search.
Skype
We can use skype to schedule meetings and we can explain easily via screen sharing to the stake holders. We can easily coordinate with internal and external stake holders with using skype.
Ms _ Visio:
Ms_Visio can be used to draw UML diagrams. We can easily identify with UML diagrams that which actor is doing which task. It will help developers to understand the requirement clearly.
UML diagrams creation such as use case, sequence diagrams, and activity diagrams.
To prepare process flow charts
To create data models
To generate architecture diagrams
Ms_Project:
Ms_Project can be used to track the requirements.
JIRA :
Jira can be used to track the requirements, issues, Change requests. Most of the organizations are using JIRA tool.
Balsamiq, axure and Pencil :
Balsamiq and axure can be used to create mockups to understand the requirement clearly. And easily we can explain to stake holders. Balsamiq Mockups helps business to work faster and smarter. Moreover, it allows projects to host online. In addition to that, it works as a collaboration tool between team and clients.
I hope this provided you the overview of Tools Used by Business Analyst.
Here I mentioned common tools used by Business Analyst, if you want to know more tools used by Business Analyst then you can browse on google.
Sample BA Document Templates
FREE DOWNLOAD
Send download link to:
Tools Used By Business Analyst : FAQ
What are the tools for business analysis?
Microsoft Office Suite. The following applications of Microsoft office suite come under the best business analysis tools list – … Google Docs. … Rational Requisite Pro. … Balsamiq. … SWOT. … Pencil. … Trello. … SmartDraw.
What are analytics tools?
What are business analytics tools? Business analytics tools are types of application software that retrieve data from one or more business systems and combine it in a repository, such as a data warehouse, to be reviewed and analyzed